During the international break times I like to take some time away from the daily grind of creating content and work on more research focused work. During this international break I wanted to take some time to work on using the pitch zones that I have in my database.
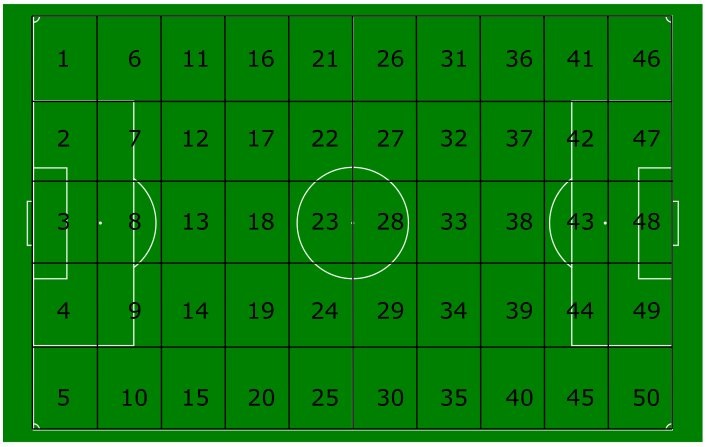
When I created the pitch zones, I had five zones across the width of the pitch and ten across the length.
One of the things that I always found interesting with these zones is looking at the different passing statistics for each zone.
So I thought it would be interesting to take the zones and use that as the basis for a way to measure passing skills. The idea for this is sort of similar to the defensive statistic Ultimate Zone Rating (UZR) from baseball.
To do this I went to my Premier League stats database that has data for the current season going back to 2015-16. There are a total of 1,333,739 passes that this is based on. I then took each zone and looked at the pass completion percentage based on which third it ended up in (Defensive third, Mid third or Final third), the length of the pass (less than 15 yards short, greater than 35 long, anything else medium) and finally the direction of the pass (forward, backward or square).
As my database expands even further it would be nice to be able to get even more granular with the different buckets but I think right now this works well. There is an average of 1,863 passes in each bucket and a median of 942 passes which I think makes things for a fairly robust sample for most buckets. For the zones with less than 100 passes, I used the average completions for the neighboring zones to make things more robust.
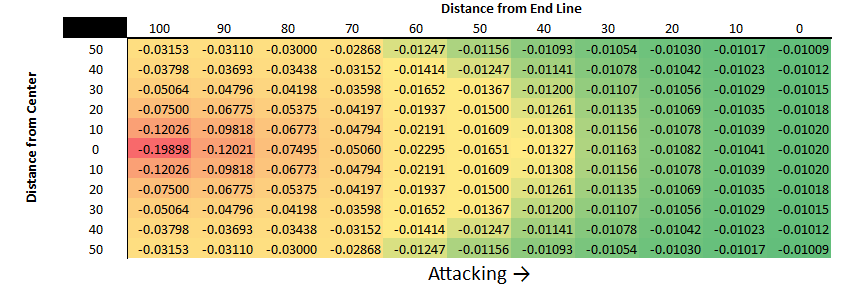
After setting the baseline for the completion percentages for each zone for each type of pass I then took that and called it "Expected Pass%" and compared that the outcome of each pass. Pass Zone Rating equals pass outcome (0 or 1) minus the expected pass completion. A completed pass will have a positive value and a missed pass will have a negative value.
Here is the top 15 in the Pass Zone Rating for this season:
The next thing that I did was look at the Pass Zone Rating and used Passing Value Added to take the expected vs actual passing and the value each pass was worth. For this, I took the passing value added and multiplied by the Pass Zone Rating and I called this Pass Zone Rating Plus.
Here is the top 15 this season in this stat:
What stands out is that there are some players that don't rate well on Pass Zone Rating but do well in this statistic. I think that is because while they don't complete a lot of passes, they do complete high value passes at a high rate.
You'll also notice on the far right there is a PZR per 1,000, I created that to normalize everyone to 1,000 passes so that people with more passes don't emerge as the leaders from accumulating a lot of easy passes.
This is a work in progress still but it is available for the 2018-19 season to Patreon Subscribers.
Showing posts with label Passing. Show all posts
Friday, November 16, 2018
Thursday, November 16, 2017
Thinking about a Passing Ability Stat
I am very happy with my passing value added stat, I think it adds more to the measuring of attacking passing but I think that it is missing something as overall passing statistic.
So today while I was procrastinating writing a stats preview for the North London Derby (Look for it tonight/tomorrow, it's got some good stuff in there!) I was thinking about passing.
One of the thoughts that popped into my head was looking at the completion percentage above average based on the three thirds of the pitch and also long passing (maybe short passing? I didn't include this but maybe I should, that is why I am writing this out).
The simplest way to do this is:
player pass completion for third / league average pass completion for third * 100
Take Mesut Ozil for Final 3rd Passing:
0.727 (his completion%) / 0.614 (Lg Avg) *100 and you get 118 which also helpfully easily translates to 18% better than league average
For this stat I did that for Defensive 3rd passing, Middle 3rd Passing, Final 3rd passing and Long Ball passing.
To combine them into one stat the are all weighted by the total number of attempts in each category for an overall number. This creates the stat that for the time being I am labeling Pass+
As a quick aside the reason I am doing these where it is because it is compared to average and setting everything to 100 is because, well I come from a baseball background where this is common and I believe that it is easier to grasp that numbers over 100 are good, 100 is average and below is bad. It also has the added benefit of each number above or below can be pretty easily described as that many percent above or below average.
The next thing that I did with this stat is bring in my passing value added stat. The reason for this is that I think a passing stat shouldn't just measure completing passes but also should also include attacking value which I think PPVA does well at.
So similar to the other stats I got this on the same scale, but for this I made an adjustment to use the 75th percentile value instead of the average because otherwise things got really screwy. Maybe someone smarter than me can give pointers on a better way to work this out but this is what I did to make the scale work out better with the other stats.
So once I had PPVA+ I combined them into one stat that for the time I am calling Passing Ability. I don't love this name and would like to think of something else. The method for combing them was that the Pass+ stats are weighted 4 times the value of PPVA+ (I did this because it is made up of 4 stats and it seemed about right, again all a work in progress).
And the tableau for the premier league to play with:Work shopping a passing ability stat (everything with a + next to it is %+/- average similar to an OPS+ stat from baseball) pic.twitter.com/govOFs6NhN— Scott Willis (@oh_that_crab) November 16, 2017
Friday, September 8, 2017
Introducing Passing Progression Value Added
For a while I have been wanting to create a way to measure passing value added.
I have added a stat that is called xG chain and xG build up that was created by Ted Knutson and Thom Lawrence for Statsbomb services. Mine might be a bit different but I have tried to follow the same general guidelines laid out in their introductory post on Statsbomb Services.
This is cool and helpful but it misses a lot of passes that don't lead to shots so I wanted to see about figuring out a way to include those. I really liked the way that Nils Mackay went about analyzing the problem and decided to use that as the starting point for my model. Mackay has gone even further in refining his model but for now I focused on making this simple for my first attempt.
What I am setting out to measure is the value added (xG in this case) between the starting point of a pass and where the pass ends.
The sporting logic behind this is that to be able to win you must score goals. Your team is better able to score goals the closer they are able to take shots to the opponents goal. Getting closer to the opponents goal through passing increases the likely hood of taking high quality shots. This last part is what I am looking to attempt to measure.
To accomplish this I use a very simple xG model to assign a value for every position on the pitch.
The equation for the xG model is this:
(1-(1/(1+((e^(-1.56335793278499+(Distance from Center*0.0000564550258161941)+ (Square Root (Distance from Endline^2+Distance from Center^2))*-0.0693321731182481)))))))
Essentialy it looks at how far you are from the center of the pitch (Closer to the Center is better) and how far you are from the center of the goal (Closer to the Center is better).
Here is what the values for areas of the field look like up and down the pitch:
To determine the value added for a successful pass this model takes the value of the ending point for the pass and then subtracts the value for the starting point for the pass.
So for example a completed pass starts at the point (60,10) and ends at the point (40,0). The end value is 0.01591 minus starting value of 0.00608 would give a simple value added of this pass of 0.00983. I have also made the decision to give a completed pass a bonus of 0.003 (the reasoning is that keeping possession to be able to continue to attack is valuable and this seems like a reasonable amount to assign, I am open to changing this) and if it starts and stays within the attacking final third an additional 0.015 is added (same reasoning as above but the attacking final third is even more important). So the total value added with this pass is 0.01283.
For an incomplete pass a player is penalized for the value to the opponent taking over at the end point of the pass. This is what the value of the pitch look like:
The values are pretty similar to above but they include the following penalties in addition to the value of where the opponents takes over: -0.01 for losing possession (the reasoning is that your team cannot attack any longer once they do not have the ball, this seems like a value that is about right but I would be open to changing) and if the pass is lost in the defensive third an additional 0.015 is subtracted.
An example again, lets say that again we try to pass from the point (60,10) and ends at the point (40,0) but is intercepted. The value for this pass would be -0.01327, -0.00327 for the opponent taking over and -0.01 for losing possession.
These calculations are done for every pass attempt in the game.
I have gone back and done this for all of the games in the 2017-18 season thus far and added this stat to the Tableau database under the passing tab.
Also here are the top 25 in raw Value Added from the Premier League through the first 3 weeks:
Passing Progression Value Added (raw total) for the first 3 weeks of Premier League top 25 pic.twitter.com/f7FZQbGnlb— Scott Willis (@oh_that_crab) September 7, 2017
Subscribe to:
Posts (Atom)