Friday, September 8, 2017

Introducing Passing Progression Value Added

For a while I have been wanting to create a way to measure passing value added.

I have added a stat that is called xG chain and xG build up that was created by Ted Knutson and Thom Lawrence for Statsbomb services. Mine might be a bit different but I have tried to follow the same general guidelines laid out in their introductory post on Statsbomb Services.

This is cool and helpful but it misses a lot of passes that don't lead to shots so I wanted to see about figuring out a way to include those. I really liked the way that Nils Mackay went about analyzing the problem and decided to use that as the starting point for my model. Mackay has gone even further in refining his model but for now I focused on making this simple for my first attempt.

What I am setting out to measure is the value added (xG in this case) between the starting point of a pass and where the pass ends.

The sporting logic behind this is that to be able to win you must score goals. Your team is better able to score goals the closer they are able to take shots to the opponents goal. Getting closer to the opponents goal through passing increases the likely hood of taking high quality shots. This last part is what I am looking to attempt to measure.

To accomplish this I use a very simple xG model to assign a value for every position on the pitch.

The equation for the xG model is this:

(1-(1/(1+((e^(-1.56335793278499+(Distance from Center*0.0000564550258161941)+ (Square Root (Distance from Endline^2+Distance from Center^2))*-0.0693321731182481)))))))

Essentialy it looks at how far you are from the center of the pitch (Closer to the Center is better) and how far you are from the center of the goal (Closer to the Center is better).

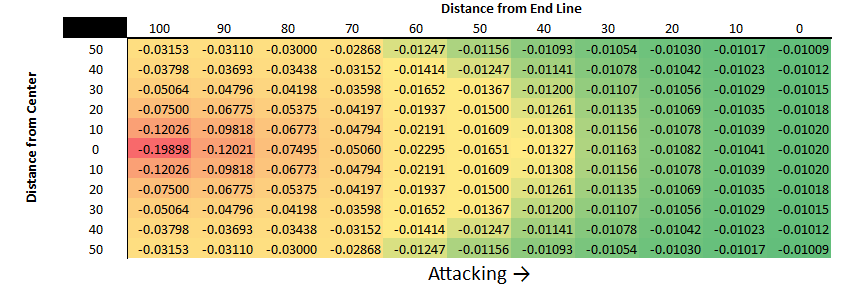
Here is what the values for areas of the field look like up and down the pitch:
To determine the value added for a successful pass this model takes the value of the ending point for the pass and then subtracts the value for the starting point for the pass.

So for example a completed pass starts at the point (60,10) and ends at the point (40,0). The end value is 0.01591 minus starting value of 0.00608 would give a simple value added of this pass of 0.00983. I have also made the decision to give a completed pass a bonus of 0.003 (the reasoning is that keeping possession to be able to continue to attack is valuable and this seems like a reasonable amount to assign, I am open to changing this) and if it starts and stays within the attacking final third an additional 0.015 is added (same reasoning as above but the attacking final third is even more important). So the total value added with this pass is 0.01283.

For an incomplete pass a player is penalized for the value to the opponent taking over at the end point of the pass. This is what the value of the pitch look like:
The values are pretty similar to above but they include the following penalties in addition to the value of where the opponents takes over: -0.01 for losing possession (the reasoning is that your team cannot attack any longer once they do not have the ball, this seems like a value that is about right but I would be open to changing) and if the pass is lost in the defensive third an additional 0.015 is subtracted.

An example again, lets say that again we try to pass from the point (60,10) and ends at the point (40,0) but is intercepted. The value for this pass would be -0.01327, -0.00327 for the opponent taking over and -0.01 for losing possession.

These calculations are done for every pass attempt in the game.

I have gone back and done this for all of the games in the 2017-18 season thus far and added this stat to the Tableau database under the passing tab.

Also here are the top 25 in raw Value Added from the Premier League through the first 3 weeks:

Thursday, September 7, 2017

Premier League Week 4 Projections

After a long international break it is time to get back to club football. As an Arsenal fan and American it has been a pretty crappy couple of weeks with the results but according to the odds it looks like things should hopefully get better.

Without any further rambling here are the odds for week 4 of the Premier League:
After several weeks with lots of heavy favorites, this week only Arsenal breaks the 50% odds barrier, As a pessimist this also likely means that of the big teams Arsenal will have their result go against them.

The Manchester City vs Liverpool match up looks really good and even with a 4:30 am kick off I will probably still do my best to wake up to watch it. I have City as the favorite but with Liverpool's track record and how they just dominated Arsenal it could definitely be closer than the odds suggest.

A new thing that I tweeted out this week is the relative strength rankings for each team that feeds into these projections.
This week we have a 1 vs 3 match up and a 4 vs 7 match up which might end up as one of the better weekends for top teams going against each other.

On the title projection front, things have narrowed down to a few favorites with the rest of the big teams falling back:

Click to Enlarge
Manchester City is still the title favorite but Manchester United and Liverpool have both moved to over 20% for the title odds.* Arsenal's season might be collapsing but I still have them as the 4th highest title odds so maybe things aren't as bad as it seems after two losses.

Another new thing I tweeted out today was the team performance compared to the expected points based on odds and based on expected goals:
This is pretty interesting, I wouldn't expect Huddersfield to keep up this performance but the points that they have already banked are very valuable and can't be take away. Also even with the only perfect record, Manchester United haven't over performed by a crazy amount, Jose might be doing his second year magic.
-
This article was written with the aid of StrataData, which is the property of Stratagem Technologies. StrataData powers the StrataBet Sports Trading Platform, in addition to StrataBet Premium Recommendations.

*Note: If teams tie on points this assigns both to that position, I have not added a goal differential to break ties. Here is a further explanation for how these projections work.

Wednesday, September 6, 2017

Explaining My Simulation Methodology

I have been meaning to get around to this for a while now and with a break in fixtures for international team games this seems like a good time to go over my simulation methodology.


Basics:

The model is built on this logic: that a soccer match result is determined by goals, goals are determined by the number of shots and the quality of those shots. So I have built the model and 1) trying to estimate the number of shots each team will have and 2) a rough idea of where these shots will be taken and the quality of the shots.

For simplicity I group shots into three location buckets, Danger Zone (6 yard box + Middle of 18 yard box), Wide Box (wide areas of the box) and Outside the Box.

I also estimate the number of headers that will occur in the game and I assume that all headers will be from the danger zone (about 95% of headers occur in this area) all other areas are shots from feet.

Lastly I estimate the number of Big Chances each team will have per game. For simplicity I also assume that all of these will occur in the danger zone (about 75% of big chances occur in the danger zone).


Determining Values:

To arrive at the values for each I have taken data from the last two seasons plus the current season. I then weight the data to get to a single value. The current weighting is 1 for 2016-17, 0.5 for 2015-16 and Games Played/19 so for this week there have been 3 matches so the weighting is 0.16 and this will go up every week.

You could certainly pick different weights for this but my thinking is that I would use last season as the baseline for each team, two years ago as half as important because there can be quite a bit of turn over in a squad in that time but still it can provide information and then a sliding scale for the current season that would put it on equal terms at the halfway point with the previous season and then have the largest weighting.

I use this weighting on the data for both offensive and defensive statistics as well as overall and home and away.

These values then feed into the simulation model to determine the number and quality of shots for each team.

Using Arsenal vs Bournemouth as an example:

Arsenal have 6.42 Danger zone shots for overall, 7.41 at home while Bournemouth allow 5.59 overall and allow 3.61 Danger Zone shots on the road. Averaging all of these I have Arsenal with a raw value of 5.69 Danger Zone shots. Taking out the expected headers and Big Chances (same methodology as above) Arsenal are left with 1.58 regular danger zone shots from feet. The decimal portion of the shot is then compared to a random number and if the decimal is higher than the random number the shots total is rounded up.

Doing this for all the different shot categories Arsenal are estimated to have 15.03 (1.58 DZ, 4.37 WB, 4.97 OB, 2.3 headers, 1.81 BC) shots but that can vary between 12 and 17 shots, compared to 10.65 (0.98 DZ, 2.29 WB, 4.32 OB, 1.78 headers, 1.27 BC) shots but can vary between 8 and 13 shots for Bournemouth.

Once the number of shots are determined each one is assigned an xG value. Danger Zone shots are 0.17 xG, Wide Box 0.06 xG, Outside the box 0.024 xG, headers 0.08xG and big chances 0.45 xG.


Simulating the match:

These values are assigned to each shot and compared to a random number. Again to our example:

Arsenal
Shot Type Value Random Result
DZ 0.17 0.610036 0
DZ 0.17 0.172277 0
WB 0.06 0.303131 0
WB 0.06 0.267087 0
WB 0.06 0.068808 0
WB 0.06 0.6799 0
OB 0.024 0.715029 0
OB 0.024 0.012071 1
OB 0.024 0.577135 0
OB 0.024 0.657269 0
OB 0.024 0.936911 0
H 0.08 0.356094 0
H 0.08 0.022968 1
BC 0.45 0.657358 0
BC 0.45 0.545432 0

Based on these results Arsenal would have scored 2 goals in this simulation.

This is done for both teams and the goals scored are compared and the result is recorded and then the simulation is run (with the decimals again compared to a new set of random numbers to simulate a bit of randomness that happens) again another 9,999 times. The odds that I present are the count of each result divided by the number of simulations.

Again to the example of Arsenal vs Bournemouth, Arsenal won 5,327 of the simulations, there was a draw 2,190 times and Bournemouth won 2,483 times. So the odds for the match would be presented as 53.3% for Arsenal, 21.9% Draw, 24.8% Bournemouth.


Simulating the Season:

For each of the remaining matches in the season the odds are determined using the above method and a similar exercise is performed to simulate the season. I use this to give odds for each team winning the league or finishing top 4 and other targets.

To help illustrate I will again use the Arsenal vs Bournemouth example. For this a random number is generated. I got 0.5058 as my random number and that is compared to odds of home win: 0 to 0.533, draw: greater than 0.533 to less than 0.753 and Away win: 0.752 to 1. With this random number Arsenal have been simulated as the winner.

This is done for each match and the number of wins, draws and losses are recorded as well as the points and where each team finished in the table. This is done another 9,999 times to simulate the season 10,000 times and then the results are presented as the simulated odds.

The latest simulation makes Manchester City the title favorites winning the title in 32.7% of simulations.


Team Strength:

Earlier today on twitter I posted something new and that is related to my simulation work. I called it team strength rankings.
Here is how that is derived.

Each team's overall shot spread is multiplied by the assigned values (basically it is a simplified xG value per game) and then compared to league average. Using Arsenal as an example, they have an estimated 1.8 xG per game overall compared to 1.3 for League Average. I then took the team value divided by league average times 100 to give the value in the tweet where 100 is league average and every point above or below represents 1% above or below the league average.

For the overall ranking it is the average of the offense and defense with that compared to league average to determine overall rank.

This is a new thing for me so this might need tweeking as I continue on.

Please let me know if things need further clarification or if I missed anything.

Monday, September 4, 2017

5 Highest Quality Chances from Premier League Week 3

A little slow getting this out this week but hey it's an international break and we are all kind of off our regular schedule.

Arsenal fans should probably avoid this week with the amount of shambolic defending that will be featured.

5) Harry Kane vs Burnley


Shot from feet in the center of the box, regular assisted shot, classified as a big chance: 0.40 xG.

Harry Kane just doesn't score in August.

4) Daniel Sturridge vs Arsenal


Shot from head from very close  range, assisted by a cross, classified as a big chance: 0.44 xG

That's about as wide open a header you will get. Sturridge did not miss his chance.

3) Mohamed Salah vs Arsenal


Shot from feet from very close range, following a cross, classified as a big chance: 0.54 xG

This is a really pretty movement from Liverpool to carve open Arsenal, Petr Cech makes a great save to deny a goal. 

2) Dele Alli vs Burnley


Shot from feet from very close range, following a corner, classified as a big chance: 0.76 xG

1) Mohamed Salah vs Arsenal 


Shot from feet from the center of the box, following a fast break, classified as a big chance: 0.77 xG

Not the best corner from Arsenal, a great one man fast break from Salah.