Showing posts with label Stats. Show all posts

Thursday, November 16, 2017

Thinking about a Passing Ability Stat

I am very happy with my passing value added stat, I think it adds more to the measuring of attacking passing but I think that it is missing something as overall passing statistic.

So today while I was procrastinating writing a stats preview for the North London Derby (Look for it tonight/tomorrow, it's got some good stuff in there!) I was thinking about passing.

One of the thoughts that popped into my head was looking at the completion percentage above average based on the three thirds of the pitch and also long passing (maybe short passing? I didn't include this but maybe I should, that is why I am writing this out).

The simplest way to do this is:

player pass completion for third / league average pass completion for third * 100

Take Mesut Ozil for Final 3rd Passing:

0.727 (his completion%) / 0.614 (Lg Avg) *100 and you get 118 which also helpfully easily translates to 18% better than league average

For this stat I did that for Defensive 3rd passing, Middle 3rd Passing, Final 3rd passing and Long Ball passing.

To combine them into one stat the are all weighted by the total number of attempts in each category for an overall number. This creates the stat that for the time being I am labeling Pass+

As a quick aside the reason I am doing these where it is because it is compared to average and setting everything to 100 is because, well I come from a baseball background where this is common and I believe that it is easier to grasp that numbers over 100 are good, 100 is average and below is bad. It also has the added benefit of each number above or below can be pretty easily described as that many percent above or below average.

The next thing that I did with this stat is bring in my passing value added stat. The reason for this is that I think a passing stat shouldn't just measure completing passes but also should also include attacking value which I think PPVA does well at.

So similar to the other stats I got this on the same scale, but for this I made an adjustment to use the 75th percentile value instead of the average because otherwise things got really screwy. Maybe someone smarter than me can give pointers on a better way to work this out but this is what I did to make the scale work out better with the other stats.

So once I had PPVA+ I combined them into one stat that for the time I am calling Passing Ability. I don't love this name and would like to think of something else. The method for combing them was that the Pass+ stats are weighted 4 times the value of PPVA+ (I did this because it is made up of 4 stats and it seemed about right, again all a work in progress).
And the tableau for the premier league to play with:

Friday, September 8, 2017

Introducing Passing Progression Value Added

For a while I have been wanting to create a way to measure passing value added.

I have added a stat that is called xG chain and xG build up that was created by Ted Knutson and Thom Lawrence for Statsbomb services. Mine might be a bit different but I have tried to follow the same general guidelines laid out in their introductory post on Statsbomb Services.

This is cool and helpful but it misses a lot of passes that don't lead to shots so I wanted to see about figuring out a way to include those. I really liked the way that Nils Mackay went about analyzing the problem and decided to use that as the starting point for my model. Mackay has gone even further in refining his model but for now I focused on making this simple for my first attempt.

What I am setting out to measure is the value added (xG in this case) between the starting point of a pass and where the pass ends.

The sporting logic behind this is that to be able to win you must score goals. Your team is better able to score goals the closer they are able to take shots to the opponents goal. Getting closer to the opponents goal through passing increases the likely hood of taking high quality shots. This last part is what I am looking to attempt to measure.

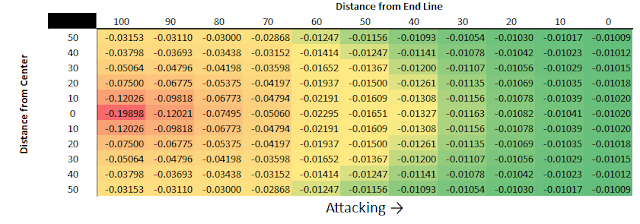
To accomplish this I use a very simple xG model to assign a value for every position on the pitch.

The equation for the xG model is this:

(1-(1/(1+((e^(-1.56335793278499+(Distance from Center*0.0000564550258161941)+ (Square Root (Distance from Endline^2+Distance from Center^2))*-0.0693321731182481)))))))

Essentialy it looks at how far you are from the center of the pitch (Closer to the Center is better) and how far you are from the center of the goal (Closer to the Center is better).

Here is what the values for areas of the field look like up and down the pitch:
To determine the value added for a successful pass this model takes the value of the ending point for the pass and then subtracts the value for the starting point for the pass.

So for example a completed pass starts at the point (60,10) and ends at the point (40,0). The end value is 0.01591 minus starting value of 0.00608 would give a simple value added of this pass of 0.00983. I have also made the decision to give a completed pass a bonus of 0.003 (the reasoning is that keeping possession to be able to continue to attack is valuable and this seems like a reasonable amount to assign, I am open to changing this) and if it starts and stays within the attacking final third an additional 0.015 is added (same reasoning as above but the attacking final third is even more important). So the total value added with this pass is 0.01283.

For an incomplete pass a player is penalized for the value to the opponent taking over at the end point of the pass. This is what the value of the pitch look like:
The values are pretty similar to above but they include the following penalties in addition to the value of where the opponents takes over: -0.01 for losing possession (the reasoning is that your team cannot attack any longer once they do not have the ball, this seems like a value that is about right but I would be open to changing) and if the pass is lost in the defensive third an additional 0.015 is subtracted.

An example again, lets say that again we try to pass from the point (60,10) and ends at the point (40,0) but is intercepted. The value for this pass would be -0.01327, -0.00327 for the opponent taking over and -0.01 for losing possession.

These calculations are done for every pass attempt in the game.

I have gone back and done this for all of the games in the 2017-18 season thus far and added this stat to the Tableau database under the passing tab.

Also here are the top 25 in raw Value Added from the Premier League through the first 3 weeks:

Monday, May 8, 2017

How I Get My Data

One of the most frustrating things about soccer (football) is that there is no easy way to get statistics. Sure you can find match results pretty easy but if you want anything more complicated most people are out of luck.

I considered looking at the Opta method, which would give a nice fire hose of data to examine but that seems expensive and this is a hobby that I was really just getting started in and wasn't willing to commit to spending that kind of money at this point. Maybe some day.

So decided that seeing as this is a hobby I do for fun I don't really have a problem spending my leisure time working on it.

The initial plan was something similar to the work that I had done in College for a project in one of my econometrics classes where I looked at NFL decisions on 4th down. For that I copied and pasted all the play by play data into excel and then cleaned the data very inefficiently. I should have learned to write code to help but I was young and dumb.

For soccer I decided that the commentary data that ends up on places like the BBC and ESPNFC looked like the best. It includes some general shot location; middle of six yard box, wide six yard box, center of the box, wide box, outside the box and long range. The shot location isn't as specific as the Opta data but the price is right on this data. It also includes who took the shot which is important and even better it also includes who set up the shot. The other great thing about this is that it also includes context for the shot, which foot or head and how it was assisted; cross, set piece, free kick, through ball, headed pass and fast break.

So I started off copy and pasting data by hand and then using excel formulas extracting the relevant data from the play by play information.

The next step in my data was using the awesome webapps that have been developed to help scrape data from the web. I currently use both import.io and ParseHub to collect the data each week and then I have a number of macros that I have written that take these big CSV files and break them into each match and extract the data that I need.

The next thing was that I really wanted big chance data, and unfortunately that isn't in the play by play commentary. To accomplish that I still go into whoscored and manually search through all the matches and enter the big chance information into the previous data. This is still a big time suck for me and I would love a better method but I have not figured out when at the moment, if you have suggestions please let me know.

So that is how I figured out how to get half way decent shot information which I know is always one of the biggest questions for people getting started in analytics.

Thursday, May 4, 2017

Updated Big 5 League Stats


Friday, April 28, 2017

North London Derby Simulation

I have been playing around with a simulation tool* and thought that it would be fun to run this weekend's North London Derby through the model and see what the results look like.


Unsurprisingly Tottenham are the favorites in this match but maybe not by as much as I would have expected given the form of both teams and their place in the table.

The biggest factor is that Tottenham are really over performing their underlying stats this season and I have built the simulation based on those underlying stats. 


On the goals scored front, you should expect them in this match, with a 0-0 draw showing up in just 5% of simulations. The most common scoreline is a 1-1 draw that wouldn't really help either team accomplish their season goals so if it that is the scoreline toward the end I expect both teams would throw everything looking for a second.

*This model has not been tested at all for accuracy on past matches. It uses this seasons stats (for and allowed) for danger zone shots, wide box shots, and shots outside the box, along with the number of these that might be headers and big chances. It then takes this data and uses a randomizer (because soccer is crazy Y'all) to produce the number and mix of shots for each team for each of the simulations. The simulation then uses a random number to simulate if a goal is scored or not for each shot. The simulation is run 10,000 times.

Thursday, April 27, 2017

Premier League Per 90 Shot Stats


I have added Minutes Played to my Premier League database for this season which has allowed me to create per 90 stats which was one of my goals to get added this year.

You can see the full leader board and play around with some filters on the Tableau page.

I am slowly going back and getting the minutes played data for the other European leagues and I hope to have that done before the year is out.

Stats in the above are Current Through 4-27-17 games.

Manchester Derby xG and Stats

Well that was a bit of a boring match, I watched it and pulled the stats so I might as well post them because everyone loves fresh content.

Not a ton to say on this, Manchester United wanted a draw when the game started and really wanted a draw after the red card. It's kind of crazy with them fighting for a Champions League spot that they would be so conservative.

Running xG:


Stats:


Manchester City

Danger Zone Wide Box Outside Box xG SoT xG Big Chance
7 1 11 1.43 0.90 1

Manchester United

Danger Zone Wide Box Outside Box xG SoT xG Big Chance
2 0 1 0.55 0.26 1

Sergio Aguero was very wasteful with his chances in this game, I have him at 1.0 of City's 1.43 xG all by him self on 9 shots, but he put just 2 on target and his shot on target xG (a different model which I should probably detail at a latter time) was just 0.36.

I wish I was further along on my projection model so I could give some sort of estimate to how this result changes top 4 chances but I am a just learning to do more than basic coding and working on that model is probably a project that will be done over the summer.